Analysis#
The application is a graphical front-end to the image processing pipeline for the analysis of “spinning disk” microscopy images. The starting point are the raw images as acquired by the microscope’s control software.
The sequence of analysis steps is:
Convert input images to 8-bit grayscale.
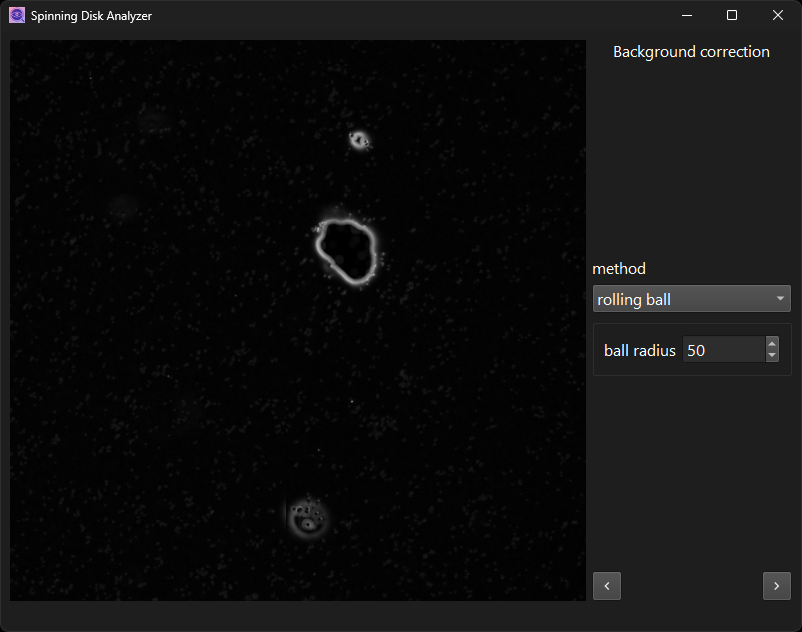
Subtract background with rolling-ball method.
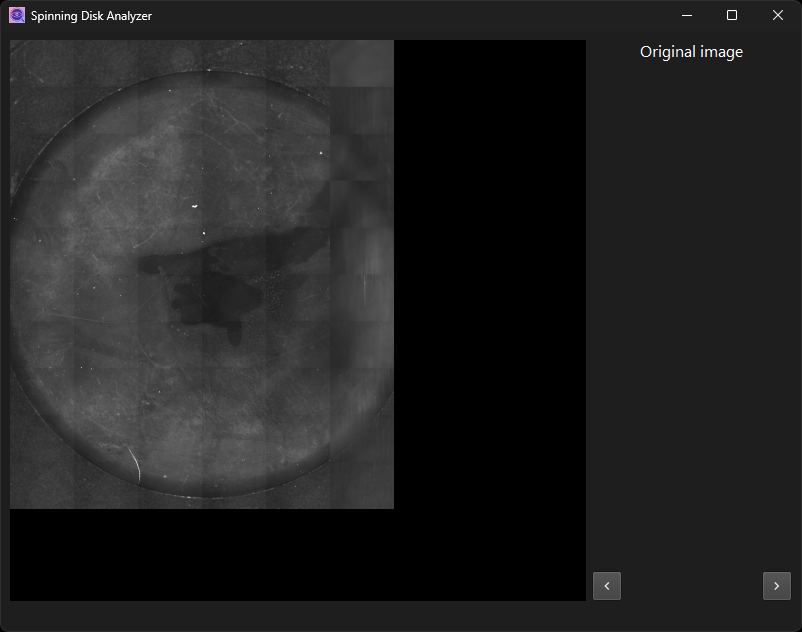
Stitch images according to scan grid.
Perform local thresholding with the Bernsen method.
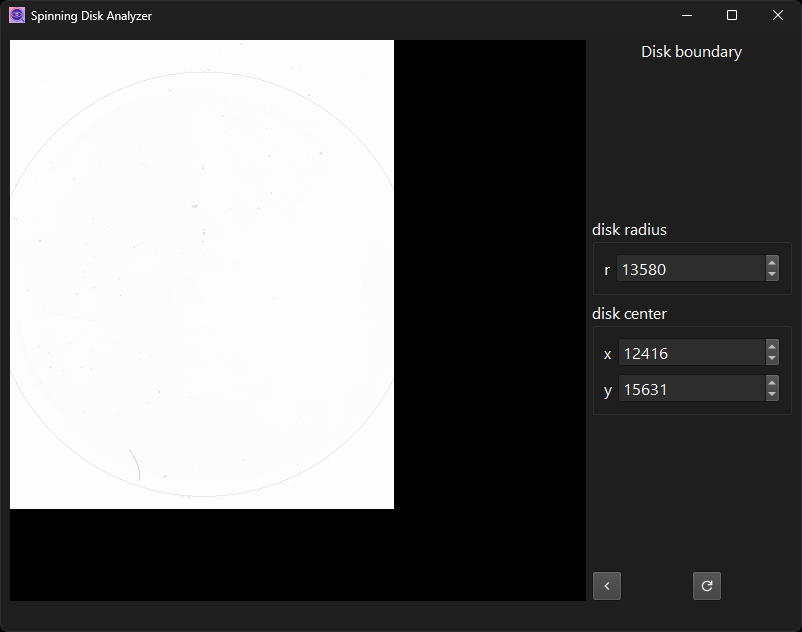
Outline disk boundary to restrict area for cell segmentation.
Perform cell segmentation on thresholded binary image.
Fit cell density data to sigmoid curve and plot it.
Image processing#
The primary input is a folder containing 60 images from a 6 by 10 scan grid. Acquisition time and grid coordinates are expected to be encoded in the file names, like so:
221220_155839_X_-10-000000_Y_-8-000000_Z_104-660000.png
221220_155845_X_-10-000000_Y_-4-522500_Z_104-660000.png
221220_155851_X_-10-000000_Y_-1-045000_Z_104-660000.png
221220_155857_X_-10-000000_Y_2-432500_Z_104-660000.png
221220_155903_X_-10-000000_Y_5-910000_Z_104-660000.png
221220_155909_X_-10-000000_Y_9-387500_Z_104-660000.png
221220_155922_X_-7-453000_Y_-8-000000_Z_104-660000.png
221220_155928_X_-7-453000_Y_-4-522500_Z_104-660000.png
…
Once the application finds the images in the folder it is given, it
will create two subfolders: analysis and tiles.
The tiles folder is effectively an internal cache that speeds up
zooming in and out of the images displayed in the user interface. You
can safely delete that folder once the analysis is done. Or at any
point, really. The tiles cache will be recreated on demand.
The analysis folder contains all intermediate images resulting from
the processing pipeline as well as the final plot. The file names
should be self-explanatory if you refer to the analysis steps listed
above.
The folder also contains a file named parameters.yaml that stores
the processing parameters from the individual analysis steps, for
posteriority. The application is designed to make sure that those
values are consistent with the image files. When parameter values are
changed in the user interface, all intermediate result files from the
corresponding analysis step all the way to the final plot are
invalidated. That is, the program deletes the corresponding files
and continues the processing pipeline from that point forward.
The parameters are initialized from default values the first time a
folder is processed by the application. Those default values can be
configured by the user: Just right-click anywhere on the application
window (other than the image viewer) and select “Edit defaults” from
the context menu that appears. This will open the primary copy of
parameters.yaml in the text editor. Change the values as you see
fit, then save and close the file. Those values will be used going
forward for all new analyses, i.e. image folders that don’t contain
a parameters.yaml file (in the analisys folder) just yet.
User interface#
The GUI application will take the user through the analysis steps in a sequence of dialog pages, much like a “wizard”. A “next” button will appear once a step is done. With the “back” button, the user can return to earlier steps. If a parameter is changed from its previous value, the “next” button will be hidden and a “redo” button be shown instead. The analysis can only continue if the step is either repeated for the new parameter value, or the value is reset to what it was previously.
The first dialog page prompts the user to select the folder with the input images You may drag and drop it onto the window or press a button to browse to the file-system location.
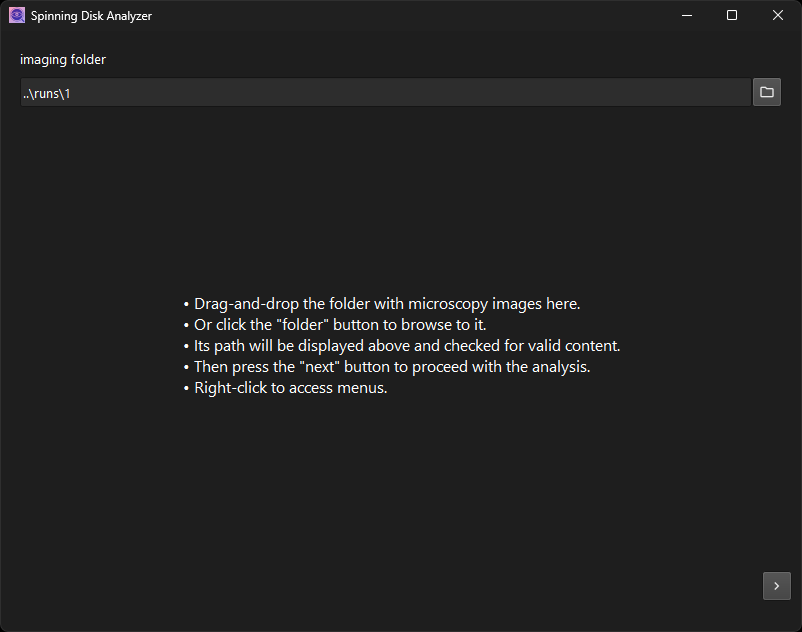
A check is performed that the folder contains the expected number of images and that they are appropriately named. Only then will the “next” button appear. Press it to get to the subsequent analysis step: the stitching of the full original image.
The processing starts once you enter a dialog page. It will typically take a while to complete. Follow the progress in the status bar at the bottom of the window.
Once the initial processing is done, the intermediate result will be displayed for visual inspection. Except for the final step, this is always an image. Zoom in and out with the mouse wheel, pan by left-clicking and dragging. Alternatively, use the keyboard to zoom. Right-click elements of the user interface to find context menus that document the shortcut keys.
Note that prior to displaying them, all images are preprocessed into smaller “tiles” at various zoom levels. This is necessary to make the display responsive to user interactions, as the resolution of the full images is prohibitively large. This extra processing step introduces some delay when the underlying image changes. It is also why the viewer offers only limited functionality. Additional convenience features, such as inverting the image on the fly, are not easy to implement.
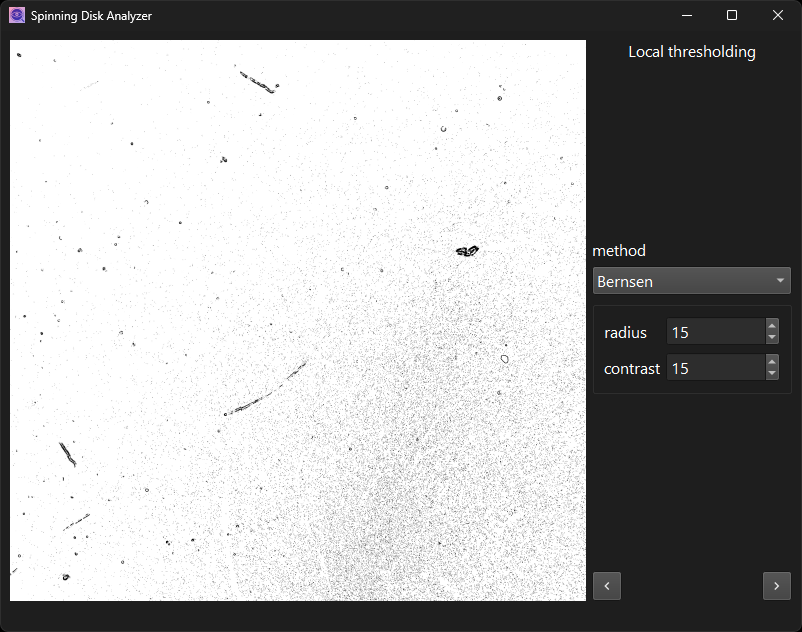
Once the initial analysis is finished, parameter values can be adjusted. A “redo” button will appear if they were, while the “next” button is hidden.
The “redo” disappears if you set the parameter values back to their
previous values. The point of this is to make sure that the results
on disk are always consistent with the parameter values stored
alongside them. The file parameters.yaml plus the original input
images should be the single source of truth. All resulting images
should be reproducible from that information alone.
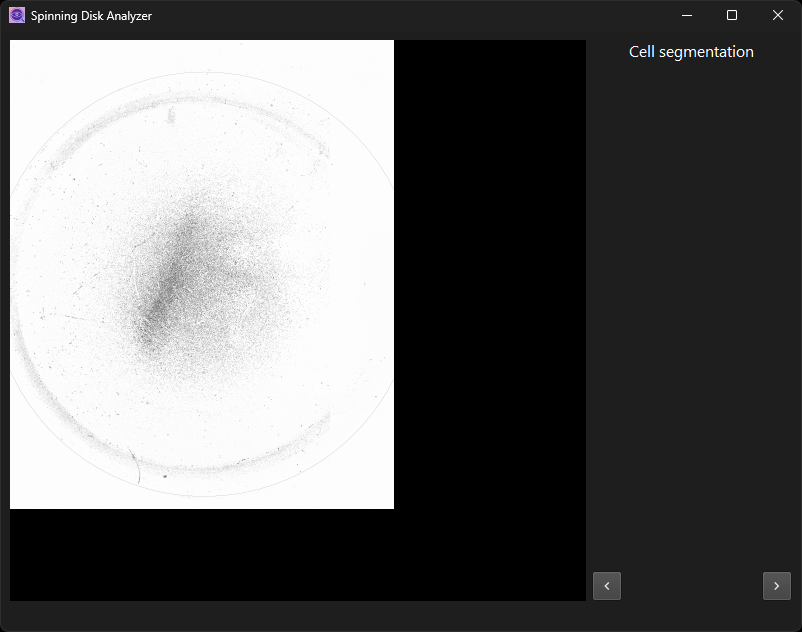
Some steps, such as cell segmentation, have no adjustable parameters. Only the intermediate image is displayed for visual inspection. Note that if you change parameters in an earlier dialog, the steps that follow will have to be recomputed as well.
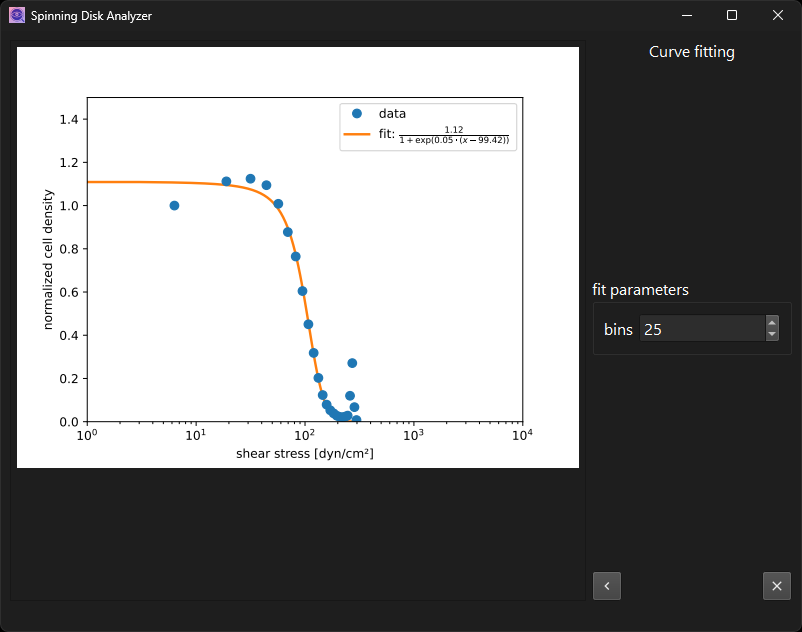
On the last page, you will find an “exit” button in lieu of the “next”
button. It will simply close the program. You can also exit the program
at intermediate steps, by closing the window. But be warned that this
may leave files on disk in an inconsistent state if you interrupt an
ongoing computation. If you experience errant behavior after that,
remove intermediate results, or even all of them, from the analysis
folder. Remove the parameters.yaml to start over from default values.